The neuromechanics of cycling
This is an excerpt from Neuromechanics of Human Movement-6th Edition by Roger M Enoka.
Although competitive cycling encompasses a range of disciplines—road, track, mountain bike, cyclo-cross, bicycle motocross (BMX), and triathlon—its fundamental feature is the circular trajectory of the crank due the force applied by the foot of the cyclist. In many cycling events, winning performances are characterized by the cyclist maximizing the amount of power applied to the crank and minimizing the forces that oppose forward progression of the bicycle (Leo et al., 2022).
Power Production
The force applied by the foot to the pedal changes in amplitude and direction during a single pedal stroke (crank rotation of 360°). The resultant force, which has tangential (perpendicular to the crank), radial (parallel to the crank), and lateral (side-to-side) components, is greater during the downstroke (0-180°) than during the upstroke (180°-360°) with a peak value at ~135° (Wilkinson et al., 2020). The product of the applied tangential force and crank velocity indicates the power produced by muscles and transferred to the crank, the magnitude of which is strongly correlated with success in competitive cycling (Faria et al., 2005a, 2005b). The average crank power during the 60 min world record ride was 509 W, which corresponded to a value of 6 W/kg of body mass.
Muscles produce power when they perform shortening contractions and absorb power when involved in lengthening contractions. The power produced by the leg muscles during pedaling corresponds to the sum of the net power produced by the muscles that span the hip, knee, and ankle joints of each leg. The relative contributions of these muscle groups to total leg power vary with cadence and cyclist position (seated or not). As determined by Wilkinson et al. (2020) with a segmental analysis (chapter 2), normalized right-leg power increased from 4.92 W/kg at a cadence of 70 revolutions per minute (rpm) to 5.47 W/kg at 120 rpm when the participants were in a seated position (table 4.2). The lower power at the slower cadence is presumably accompanied by an increase in the power produced by the upper body pulling on the handlebars.
A similar increase in normalized leg power at the faster cadence was also observed in the nonseated position (4.95-5.67 W/kg). Significantly, the relative contributions of the net joint powers to total leg power changed with cadence, cyclist position, and power production: the greatest contribution at both cadences and positions was provided by the hip muscles, and the percent contribution increased with cadence and the nonseated position (table 4.2). In contrast, the relative contribution of the knee muscles (extensors and flexors) to the net power decreased substantially with the change in position.
Competitive cyclists will typically assume a nonseated position when riding up a hill or when sprinting. In the nonseated position, the direction of the reaction force from the crank remains in front of the cyclist’s CM throughout the entire crank cycle, whereas it passes behind the CM during the first 45° of the crank cycle in the seated position. The ensuing shift in the relative contributions of the net joint powers (table 4.2) to the total leg power due to the change in position reflects some adjustments in the activation of leg muscles. The major muscles that contribute to leg power are those that produce extension about each of the three joints (Hug and Dorel, 2009).
When cyclists are required to achieve a target crank power (force × velocity), EMG amplitude is greater at 70 rpm than at 120 rpm due to the need to produce a greater force at the slower cadence (Wilkinson et al., 2020). Average EMG amplitude across the two cadences and positions ranged from 15% to 30% of the peak value observed during a test of maximal power production. The only muscle to exhibit a change in amplitude across positions (less in the nonseated position) was biceps femoris (a two-joint muscle that contributes to hip extension and knee flexion), but this was not associated with a reduction in either power production at the hip joint or power absorption at the knee joint (Wilkinson et al., 2020).
Power can also be measured with a power meter, which is a device that measures the torque applied to the crank and combines it with cadence to determine crank power (Faria et al., 2005a; Leo et al., 2022). The measured power can be displayed on a monitor mounted on the handlebars and thereby provide real-time feedback to the cyclist. Many competitive cyclists are familiar with these types of devices and use the measure of crank power to regulate performance during a specific event. For example, experienced cyclists know the maximal power they can sustain for specific durations (e.g., 8, 20, or 60 min). The maximal power that can be sustained during a 60 min ride is known as the functional threshold power, which seems to represent a critical threshold above which the metabolic demands experienced by the cyclist will impair performance (Chorley and Lamb, 2020).
The controlled variation in crank power during a race, such as an increase when riding uphill and a decrease when going downhill, is referred to as a pacing strategy (Faria et al., 2005b). Pacing strategies include maintaining a constant crank power, increasing it during the second half of an event, modulating it by ±5% from the mean value during each 5 min section of the race, varying it by ±5% according to wind velocity (head wind vs. tail wind), and varying it with the grade of the course (increase it on uphill sections). The preferred strategy depends on the type of race in which the cyclist is competing, such as racing against the clock or other competitors. The most common strategy used by racing cyclists seems to be a variable-pace strategy.

Opposing Forces
There are two primary forces that impede the forward progress of a cyclist when riding on level terrain: air resistance and rolling resistance, which together are referred to as tractive resistance. As discussed in chapter 2, air resistance in cycling corresponds to the force that opposes the movement of the cyclist (person + equipment) through the air. The magnitude of this force is proportional to a constant (k), the size of the projected area (A), and the squared value of the cyclist’s velocity relative to air velocity (equation 2.12). The first two variables are the most significant contributors to the air resistance encountered by cyclists (Edwards and Byrnes, 2007). Because the constant k includes the drag coefficient (Cd), it is influenced by the extent to which the laminar flow of streamlines is disrupted (figure 2.14). Cd depends on the shapes and material properties of the cyclist’s attire and equipment and has been reduced over the years by advances in equipment technology (Peterman et al., 2015). Similarly, decreases in the size of A, such as going from an upright to a fully crouched position, will reduce air resistance by 30% to 35% (Faria et al., 2005b).
Together, Cd and A determine the amount of pressure drag experienced by the cyclist, which corresponds to the impeding force caused by the difference in air pressure between the front and back of the cyclist. The force is reduced by decreasing the front air pressure, which explains the benefit of drafting behind a lead rider who reduces the front-side air pressure for trailing riders. The decrease in the drag force by drafting can be substantial. For example, in a study of 13 competitive cyclists riding at 45 km/h on a level road, Cd was reduced by an average of 42% and crank power was decreased by 33% when drafting behind a lead rider (Edwards and Byrnes, 2007). Moreover, the savings achieved by drafting increased with the computed drag area (m2)—combined effects of Cd and A of the bicycle and rider—of the lead rider. The drafting effect seems to depend more on the ratio of drag area for the leader and drafter than it does on Cd and A and may be influenced by the ability of the drafter to remain in the wake of the leader.
By reducing pressure drag, drafting improves cycling economy by decreasing the expenditure of metabolic energy to perform a given amount of work. As indicated in figure 4.24, the ability to perform the same amount of work for a lesser energy cost (moving from point 4 to point 3 in figure 4.25) represents an improvement in economy. In cycling and running, economy is measured as the whole-body rate of oxygen or metabolic energy consumption to perform a prescribed task, such as cycling (Swinnen et al., 2018) or running at a specific speed (Kipp et al., 2019).
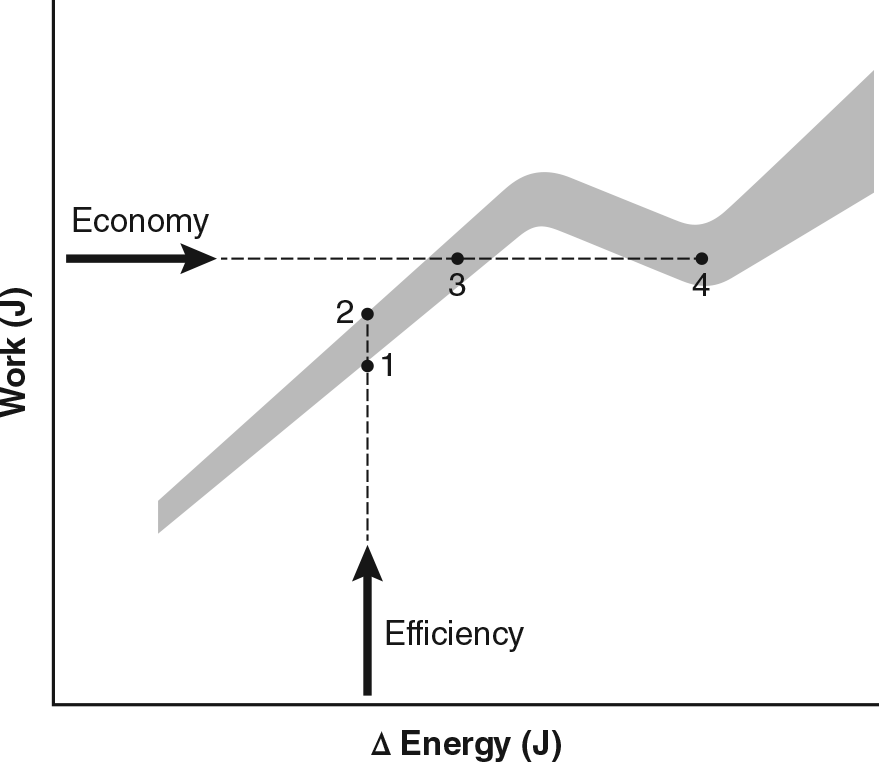
Sometimes economy is confused with efficiency, which refers to the performance of more work for the same energy cost; moving from point 1 to point 2 in figure 4.25 indicates a more efficient performance. Exercise efficiency during cycling can be measured as the ratio of mechanical power (crank power) to metabolic power (rate of oxygen consumption), but the various metrics produce estimates that differ from the known efficiency (32%) with which muscle converts the phosphorylation of ATP into work (Reger et al., 2013). The most appropriate measure of efficiency in cycling is known as gross efficiency, which can be calculated as the ratio of work rate (power production) to the rate of metabolic energy consumption (Ettema and Lorås, 2009; Reger et al., 2013).
The time it took 19 competitive cyclists to ride a 22.1 km road course was strongly correlated with both crank power at peak oxygen consumption measured in a laboratory (r = −0.92) and average crank power during the time trial (r = −0.92) when normalized to drag area (Peterman et al., 2015). The correlations were much weaker when the two variables were not normalized to drag area. This result suggests, at least for this cohort of cyclists, that time-trial performance was more strongly influenced by differences in air resistance than physiological attributes related to peak oxygen consumption and economy of energy expenditure.
The other opposing force when riding on level terrain, rolling resistance, effectively reflects the impediment provided by the contact of the tires with the road (Peterman et al., 2015). It is influenced by such factors as wheel diameter, type of tire, inflation pressure, and type of road surface. It can be estimated as the intercept value on a graph of the relation between tractive resistance (air resistance + rolling resistance) and average velocity over a range of speeds when riding on a level terrain. Although the opposing force due to rolling resistance experienced by a competitive cyclist on a level terrain is relatively small (less than 10 N), its cumulative effect over the course of a race can be significant.
When cyclists ride on uneven terrain, gravity introduces another opposing force that must be managed by the rider. Riding uphill, for example, requires the cyclists to expend energy to raise the CM (body + equipment) above the baseline level. In this instance, the muscles must perform work to displace the CM in both the horizontal and vertical directions. The increase in energy expenditure when riding uphill imposes greater demands on the cardiorespiratory system as indicated by increases in heart rate, oxygen consumption, and ventilation rate.
As a fundamental movement, the performance of elite cyclists provides an opportunity to examine the interaction between technical developments in equipment design and neuromechanical adaptations in highly trained athletes.
More Excerpts From Neuromechanics of Human Movement-6th EditionSHOP

Get the latest insights with regular newsletters, plus periodic product information and special insider offers.
JOIN NOW
Latest Posts
- How do I integrate nutrition education into PE?
- How does the support of friends and family influence physical activity?
- What makes the Physical Best approach unique?
- Strength training gimmicks . . . or not?
- How do vitamins and minerals support our bodies?
- Why do many people have difficulty losing weight?